


For industrial engineers, plant managers, and procurement heads in India, purchasing capital equipment often triggers a microscopic review of upfront costs. When sourcing measurement instrumentation for critical fluid handling—whether for hydraulic systems, lubrication skids, or furnace oil boilers—the immediate focus naturally gravitates toward the initial capital expenditure (CapEx). However, evaluating fluid measurement solutions solely on their invoice value is a critical engineering misstep. The true financial impact of flow measurement equipment lies in the operational expenditure (OpEx), maintenance frequency, and, most importantly, the financial bleed caused by volumetric inaccuracies over time.
This technical analysis breaks down the comprehensive oil flow meters total cost of ownership India. We will move beyond marketing specifications to dissect the real-world costs of installation, periodic NABL calibration, unplanned downtime, component wear, and signal drift. By converting microscopic measurement errors into quantifiable INR (₹) losses, this guide provides a rigorous framework to evaluate your fluid transfer infrastructure. Furthermore, we will outline a practical ROI methodology designed for Indian plant environments, proving that high-precision measurement is not an operational luxury, but a mandatory requirement for fiscal plant management.
In This Article
1. Product Overview and Cost Context
Before calculating lifecycle costs, it is essential to establish the technical parameters of the measurement instrument. The Oil Flow Meters utilized in modern Indian manufacturing are engineered to provide absolute volumetric accuracy regardless of fluid viscosity or pressure fluctuations. Unlike velocity-based meters, positive displacement (PD) architectures—specifically oval gear designs—trap a precise volume of fluid within isolated compartments. This mechanical isolation ensures that the rotational output is directly proportional to the volume of oil passing through the pipeline.
These meters are built for demanding environments, featuring lightweight yet highly robust aluminum alloy construction. They accommodate line sizes from 6mm (1/4") up to 150mm (6") and handle vast flow ranges from a mere 1.0 Liters Per Hour (LPH) up to 24,000 LPH. In terms of data acquisition, they bridge the gap between mechanical measurement and modern SCADA systems by offering electronic digital displays paired with analog 4-20 mA and serial RS485 MODBUS outputs.
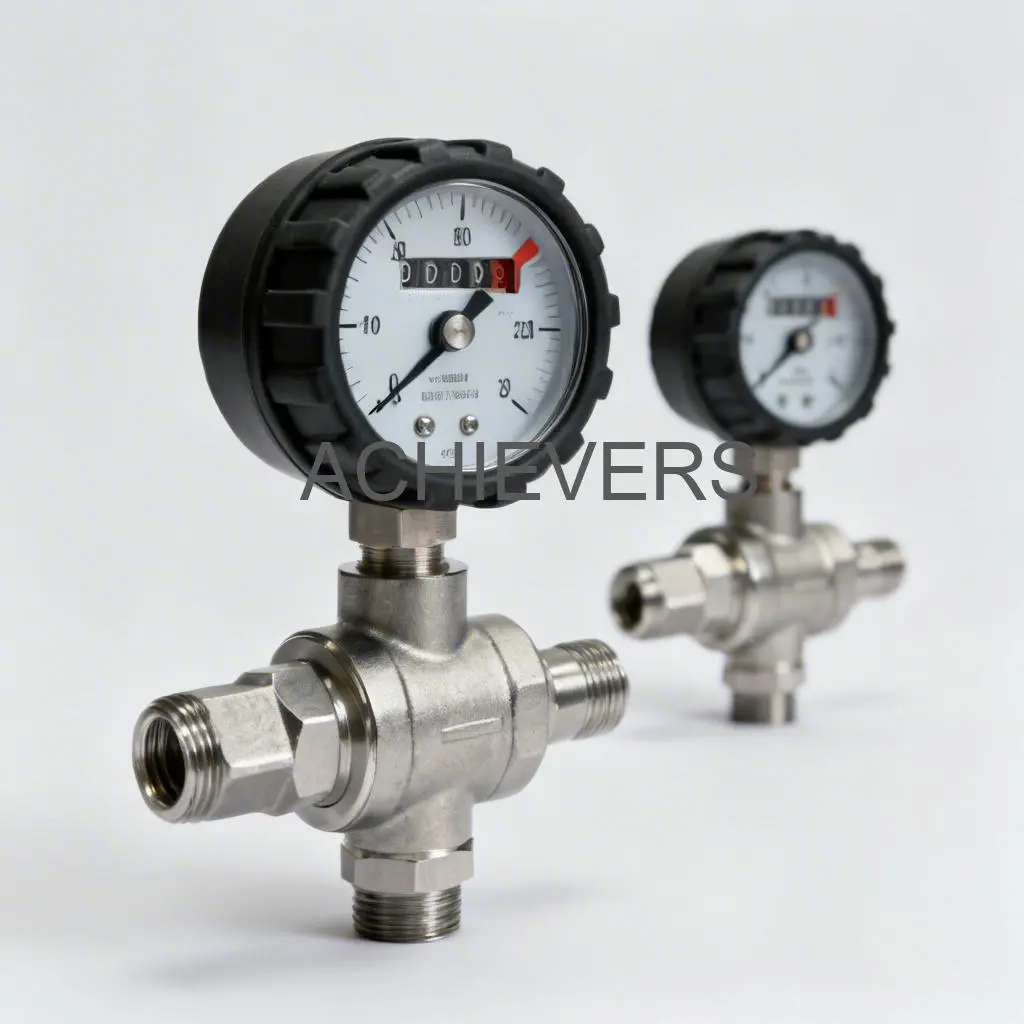
The primary driver of their financial value is their precision: ±0.5% accuracy of reading and an exceptional repeatability of ±0.1%. When handling high-value fluids like synthetic lube oils or high-temperature furnace oil (capable of operating up to 150°C), this level of accuracy translates directly into material savings.
Below is a technical summary of the parameters that directly influence the cost context:
| Technical Specification | Parameter Range / Details | Engineering Impact on Cost & ROI |
| — | — | — |
| Measurement Principle | Positive Displacement (Oval Gear) | Eliminates straight-pipe run requirements; reduces installation space and piping modification costs. |
| Flow Rate Capability | 1.0 LPH to 24,000 LPH | Standardizes inventory; a single meter type can scale from pilot dosing to bulk unloading. |
| Line Size Compatibility | 006mm to 150mm (1/4" to 6") | Seamlessly integrates into existing Indian plant infrastructure without extensive custom reduction flanges. |
| Accuracy & Repeatability | ±0.5% Accuracy, ±0.1% Repeatability | Prevents over-dispensing and billing disputes; directly minimizes invisible material losses. |
| Temperature Tolerance | Up to 150°C | Capable of handling heated Furnace Oil without thermal expansion warping the gears. |
| Signal Output | 4-20 mA and RS485 MODBUS | Integrates with existing PLCs without requiring expensive proprietary signal converters. |
| Warranty & Support | 1 Year + 2 Years Extended (On Demand) | Caps unplanned maintenance OpEx; supported by accessible domestic spare parts. |
2. Total Cost of Ownership Breakdown
To calculate the true financial burden of measurement infrastructure, procurement teams must project costs over a standard 5-to-10-year industrial lifespan. The upfront purchase price of Oil Flow Meters typically represents only 20% to 30% of the total cost of ownership (TCO). The remaining 70% is distributed across installation, integration, calibration, maintenance, and the hidden cost of accuracy drift.
In Indian industrial environments, factors such as inconsistent power quality, high ambient temperatures, and particulate contamination in bulk fluids heavily influence these OpEx variables.
| Cost Component | Typical Range (INR) | Frequency | Notes for Indian Industrial Plants |
| — | — | — | — |
| Upfront Capital Expenditure (CapEx) | ₹20,000 – ₹2,50,000+ | Once per lifespan | Varies drastically based on line size (6mm vs 150mm), material grade, and digital output requirements. |
| Installation & Piping Modifications | ₹5,000 – ₹35,000 | Once at commissioning | Includes welding flanges, installing isolation valves, bypass loops, and integrated mesh strainers. |
| Electrical & SCADA Integration | ₹3,000 – ₹15,000 | Once at commissioning | Cabling for 4-20mA/RS485, PLC programming, and implementing power conditioning to prevent signal spikes. |
| Initial & Periodic Calibration (NABL) | ₹4,000 – ₹12,000 | Annually / Bi-annually | Essential for ISO compliance and maintaining the ±0.5% accuracy baseline. Includes transport to test benches. |
| Consumables & Wear Parts | ₹2,000 – ₹10,000 | Every 1–3 years | Replacement of mesh strainers, O-rings, and occasionally the oval gears if subjected to highly abrasive fluids. |
| Annual Maintenance Contract (AMC) | 8% – 15% of CapEx | Annually | Secures OEM technician support, preventive maintenance schedules, and priority troubleshooting. |
| Downtime Losses (Per Event) | ₹10,000 – ₹5,00,000+ | Variable (Unplanned) | Cost of halted production during meter failure. Minimized by the robust aluminum alloy construction and local spare availability. |
| Accuracy Drift / Material Loss | ₹50,000 – ₹15,00,000+ | Annually (if neglected) | The cost of unmeasured fluid given away due to mechanical wear or lack of step-less calibration adjustments. |
3. ROI Calculation: Real-World Indian Example
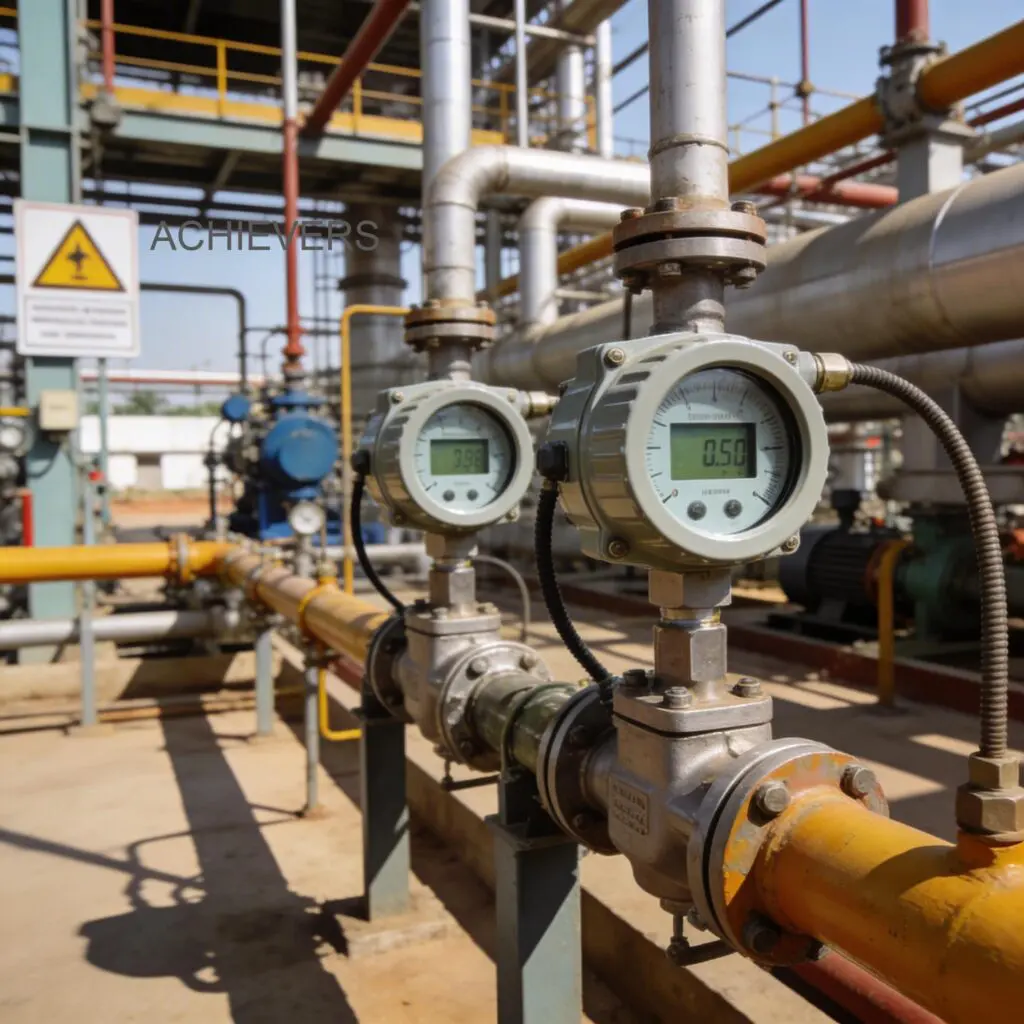
To move beyond theory, we must execute an oil flow meter ROI payback calculation for Indian industry using a realistic scenario. Consider a medium-sized manufacturing plant in Gujarat that utilizes high-temperature furnace oil for its boiler operations. The plant unloads bulk furnace oil from tankers into daily service tanks.
The Baseline Scenario:
- Fluid: Furnace Oil (Viscous, heated to ~90°C).
- Transfer Volume: 15,000 Liters per day.
- Operating Days: 300 days per year.
- Cost of Furnace Oil: ₹50 per Liter.
- Current Measurement: Manual dip-sticking and basic uncalibrated mechanical meters yielding an average volumetric error of 2.0%.
The Solution:
Installing a high-capacity 100mm Oil Flow Meters equipped with RS485 outputs, backed by a strainer and an extended warranty. The new meter guarantees an accuracy of 0.5%, effectively recovering 1.5% of previously lost or unaccounted fluid.
Here is the step-by-step ROI and payback calculation:
- Establish Baseline Annual Consumption:
- Calculate Total Annual Fluid Value:
- Quantify Existing Measurement Error Loss (2.0%):
- Project New Accuracy Savings (1.5% Improvement):
- Determine Equipment CapEx:
- Add Integration and Installation OpEx:
- Deduct Annual Maintenance and Calibration:
- Compute Simple Payback Period:
15,000 Liters/day × 300 days = 4,500,000 Liters per year.
4,500,000 Liters × ₹50/Liter = ₹22,50,00,000 (₹22.5 Crores).
₹22,50,00,000 × 0.02 = ₹45,00,000 lost annually due to supplier short-filling or internal accounting discrepancies.
By reducing the error margin from 2.0% to 0.5%, the plant recovers 1.5% of the total fluid value.
₹22,50,00,000 × 0.015 = ₹33,75,000 Gross Annual Savings.
Procurement of the 100mm oval gear meter, complete with digital registers and RS485 communication: ₹1,80,000.
Flanges, bypass piping, mesh strainer installation, and PLC integration labor: ₹45,000.
Total Initial Investment = ₹2,25,000.
Estimated yearly NABL calibration, filter cleaning, and AMC costs: ₹25,000/year.
Net Annual Savings = ₹33,75,000 – ₹25,000 = ₹33,50,000.
(Total Initial Investment / Net Annual Savings) × 12 months.
(₹2,25,000 / ₹33,50,000) × 12 = 0.80 Months (Approx. 24 Days).
In this highly typical scenario, the precision instrument pays for itself in less than a month. If this plant decides to fully automate their mixing and dispensing lines in the future, integrating this meter with a Liquid Batching System will yield even higher operational efficiencies by eliminating human intervention entirely.
4. Cost Comparison: Available Approaches
When evaluating positive displacement oil flow meter cost vs savings India, it is vital to benchmark the proposed technology against alternative fluid measurement methods. Plant managers frequently attempt to value-engineer their facilities by opting for cheaper technologies, only to incur massive OpEx penalties later.
| Measurement Approach | Upfront Capital Cost | Annual Maintenance Cost | Volumetric Accuracy | Reliability in Viscous/Dirty Oils | Best Suited For |
| — | — | — | — | — | — |
| Manual Tank Dipping / Sight Glasses | Lowest (₹2,000 – ₹5,000) | Low (₹0) | Poor (±3.0% to ±5.0%) | High (No moving parts), but highly prone to human error and density changes. | Non-critical storage, rough estimations, facilities with no automation. |
| Variable Area Rotameters | Low (₹5,000 – ₹15,000) | Low (₹2,000) | Moderate (±2.0%) | Low. Floats stick in viscous fluids; requires constant cleaning and vertical installation. | Very light, clean oils; localized visual monitoring without data logging. |
| Turbine Flow Meters | Medium (₹15,000 – ₹40,000) | Medium (₹5,000 – ₹10,000) | Good (±1.0%) | Poor for high viscosity. Bearings wear out quickly if the fluid lacks lubricity or has particulates. | High-speed, low-viscosity applications. (For diesel specific use, a dedicated Fuel Flow Meter is often preferred over general turbines). |
| Positive Displacement (Oval Gear) Meters | High (₹20,000 – ₹2,50,000+) | Low to Medium (₹5,000 – ₹15,000) | Excellent (±0.5%) | Extremely High. Handles varying viscosities seamlessly. Rugged aluminum body withstands harsh conditions. | Lube oils, furnace oils, hydraulic fluids, batching systems, tanker unloading. |
The comparative data makes it clear: while PD oval gear meters require a higher initial CapEx, their immunity to viscosity changes and superior ±0.5% accuracy create a financial firewall against material losses, making them the most cost-effective solution over a 5-year lifecycle.
5. Hidden Costs to Budget For
Indian industrial infrastructure presents unique challenges. When planning your procurement, calculating the base price of the hardware is insufficient. Failing to account for installation realities will inevitably lead to budget overruns. You must calculate the oil flow meter accuracy loss cost per year India alongside the following six hidden integration expenses:
- Mandatory Upstream Filtration (Strainers):
- Power Conditioning and Shielded Cabling:
- Calibration Logistics and Transport:
- Fluid Heating and Heat Tracing (For Viscous Oils):
- Piping Modifications for Stress Relief:
- Proprietary Spares vs. Domestic Availability:
Positive displacement meters operate with microscopic clearances between the oval gears and the measuring chamber. Indian bulk oil supplies often contain rust, pipe scale, and particulates. An integrated mesh strainer is non-negotiable. Budgeting for duplex strainers ensures you do not have to halt production to clean a clogged filter.
Industrial plants frequently suffer from voltage spikes, harmonics from variable frequency drives (VFDs), and poor grounding. If you are utilizing the 4-20mA or RS485 MODBUS outputs, you must invest in high-quality shielded twisted-pair cables and potentially galvanic isolators to prevent electrical noise from corrupting the flow data.
While Oil Flow Meters maintain their repeatability (±0.1%) exceptionally well, ISO 9001 and API standards mandate periodic calibration. Budget for the logistical cost of safely decoupling the meter, shipping it to a NABL-accredited laboratory, and utilizing a bypass line or temporary spool piece to keep your plant running during the 5-to-7-day calibration window.
When measuring heavy base oils or furnace oil, the fluid must be kept at a pumpable viscosity. While the meters can withstand up to 150°C, if the pipeline cools during a shutdown, the oil solidifies. Budget for electrical heat tracing or steam jacketing around the meter installation to prevent startup damage.
Meters should never be used to support the weight of the piping network. Installing pipe supports, expansion joints, and isolation valves immediately before and after the meter adds to the mechanical OpEx but prevents casing distortion and gear binding.
Importing flow meters from European or American OEMs often introduces severe hidden costs. A simple replacement O-ring or replacement digital register can take 8 weeks to arrive and incur massive import duties. Sourcing from Indian manufacturers guarantees quick spare parts availability and lower lifecycle maintenance costs.
6. How to Justify the Purchase to Management
Engineers know that upgrading to positive displacement technology is the right technical decision, but corporate management requires financial justification to release capital. To effectively buy oil flow meters India industrial buyers must construct a bulletproof business case.
Follow these systematic steps to secure procurement approval:
- Document Current Material Losses: Do not rely on estimates. Track the variance between supplier invoices (what you paid for) and actual plant consumption (what your boilers or batching systems used) over a 30-day period. Convert this volumetric discrepancy into a hard rupee figure.
- Highlight the Risk of Viscosity Fluctuation: Explain to management that cheaper turbine or velocity meters lose accuracy when ambient temperatures drop and oil thickens. Emphasize that positive displacement oval gear meters are immune to these viscosity changes, ensuring consistent measurement year-round.
- Present the Total Cost of Ownership (TCO) Model: Use the 5-year TCO framework outlined in Section 2. Show that the slightly higher initial CapEx of the precision meter is offset by virtually zero accuracy drift and a dramatic reduction in fluid wastage.
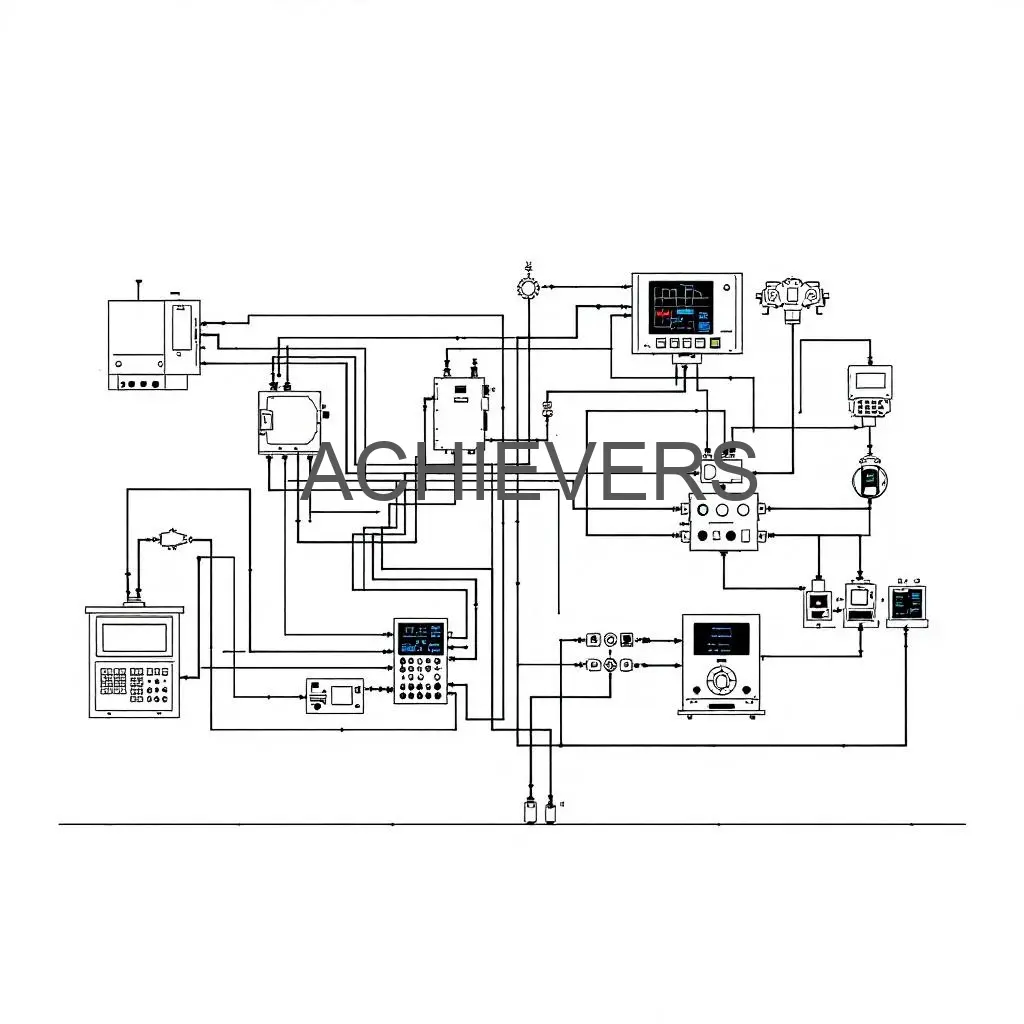
- Emphasize Process Efficiency and Automation: Detail how the electronic digital display with its RS485 MODBUS output will integrate directly into the plant's central ERP or SCADA system. This eliminates manual logbooks, prevents transcription errors, and reduces labor hours required for inventory management.
- Leverage the Warranty as Risk Mitigation: Point out that the proposed equipment comes with a strong support net. Highlight the "1 year warranty + 2 years extended warranty on demand" as a guarantee against premature failure and unplanned CapEx replacement.
- Calculate the ROI and Payback Period: Present the calculation from Section 3. When management sees that the equipment pays for itself within a few months (often under 90 days), the CapEx approval transforms from an "expense" into a high-yield operational investment.
FAQ
Q: Will changes in oil temperature or viscosity affect the accuracy of the meter?
A: No. Because these meters utilize an oval gear positive displacement design, they measure absolute volume mechanically. Unlike turbine meters, variations in fluid viscosity or ambient temperature do not compromise the ±0.5% accuracy specification, making them perfect for varying Indian climates.
Q: What is the maximum temperature the meter can handle?
A: The standard aluminum alloy construction can accurately measure high-temperature, high-viscosity fluids like Furnace Oil up to 150°C.
Q: Can this meter be connected to our plant's central PLC?
A: Yes. The electronic digital display is equipped with both analog 4-20 mA and Serial RS485 MODBUS outputs, allowing seamless real-time data integration with your existing SCADA or PLC automation systems.
Q: Do I need a straight run of pipe before and after the meter?
A: Unlike ultrasonic or turbine meters that require long straight pipe runs to condition the flow profile, positive displacement meters are not affected by external factors caused by the installation layout. They can be installed in tight spaces without compromising accuracy.
Q: How often should the meter be calibrated?
A: For critical billing, batching, or custody transfer applications, annual NABL calibration is recommended. The equipment features a step-less calibration system, ensuring that accuracy remains highly consistent between these periodic calibration intervals.
Q: What maintenance is required to ensure a long lifespan?
A: Maintenance is minimal but critical. The most important requirement is ensuring the integrated mesh strainer is cleaned regularly to prevent abrasive particulates from scoring the oval gears. The design prioritizes quick and easy serviceability.
Q: Is the display readable if the pipe is installed vertically?
A: Yes. The register top is designed for versatility and can be easily removed and rotated to every 90º orientation, allowing for clear display reading whether the meter is installed in a horizontal or vertical pipeline.
To stop invisible fluid losses and optimize your plant's operational expenditures, precision measurement is mandatory. Contact our engineering team today with your fluid type, minimum and maximum flow rates, line size, and specific site conditions to receive a customized technical proposal and ROI assessment for your facility.
